
What Vbrick Video Analytics Measure
Vbrick video analytics report on the people watching your video, not on what is in the video. For every live webcast and on-demand video, you can see who watched, how long they stayed, where they dropped off, whether they completed required content, and how well the stream performed on their device and network. The data covers video played inside Vbrick and video embedded in your own portals, learning systems, and applications.
The reports fall into three groups: viewer engagement, compliance and attestation, and stream quality. Each is described below, and all of it exports to CSV.

Understand Every Viewer, on Every Device, in Every Region
Vbrick’s enterprise video analytics deliver viewer engagement metrics and stream quality insights for live webcasts and video on demand. Understand your audiences wherever they are in the world, improve their experience, and prove the return on every video.
Why You Need Enterprise Video Analytics
Your enterprise is doubling down on video to keep your hybrid workforce engaged and informed. But understanding users’ experience and engagement levels with your digital content can be challenging. You need the ability to see both big-picture trends and granular user metrics to make sure your videos are working as hard as they should.
Video Engagement Metrics You Can Track
Viewer engagement: Views and unique viewers, total and average watch time, completion rate, and drop-off by timestamp so you can see the exact moment attention fell away. Compare high-performing videos against low-performing ones to find what the successful ones have in common.
Compliance and attestation: Who has watched mandatory training, safety, or legal videos and who has not, with poll responses and chat participation time-stamped per viewer. Device, browser, and location details support audits and identity checks, and every report exports to CSV for your records.
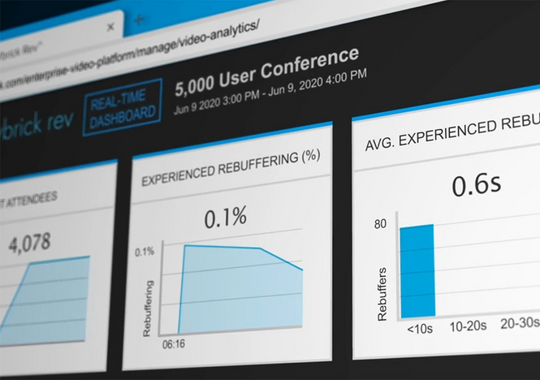
Live stream analytics: Real-time monitoring of attendance and stream health during CEO town halls and other critical live events, with quality-of-experience metrics such as buffering and error rates at the individual viewer level so you can pinpoint network bottlenecks while the event is still running.
Trends over time: Aggregated engagement and experience trends across audiences, regions, and content types so you can adjust your video strategy quarter over quarter rather than video by video.
Key Features
Granular user insights
Get a detailed look at viewing times, drop-offs, completion rates, and more, including who has and has not watched required content.
Comprehensive reporting
Understand who is watching video content across your enterprise, whether in Vbrick or embedded in other applications.
Data aggregation and analysis
Quickly surface experience and engagement trends across your audiences, so you can optimize your video strategy over time.
Real-time performance monitoring
Ensure an optimal experience for critical live events such as CEO town halls.
Pinpoint network bottlenecks
Understand the quality of live streams at the individual user level.
Enhance Your Videos with Vbrick’s Actionable Insights
Vbrick’s intelligent video analytics solution offers actionable insights to help you discover what makes your videos work, and what is holding them back. Some things you can do with these intelligent video analytics are:
- Compare the metrics of your successful videos with your unsuccessful ones. With these, you can quickly discover what commonalities and differences they share for actionable insights into what keeps your viewers’ attention.
- Break down videos into individual segments to find issues at specific timestamps. For example, if there’s a common timestamp when employees stop watching, you can look at that part to find technical issues, or to see whether interest simply drops off at that point.
- Use analytics to learn exactly what’s affecting video success rates. This enables you to improve your videos, both in terms of content and technical issues, such as excessive buffering or frequent error messages.
- Keep track of who’s watching your mandatory content, such as training, safety, or legal videos. You can then follow up with any employees who haven’t yet viewed them.
- Gain insights into trends by placing a poll in your video and implementing a chat, which you can analyze later. These also can ensure viewer engagement.
How Customers Use Vbrick Video Analytics
Two examples of the reporting in day-to-day use:
Daily shift briefings with proof of completion
Our customer has daily video briefings to share information and engage employees. Employees begin each shift reviewing a short video on a laptop, tablet, or mobile device through the security-enhanced Vbrick platform. Vbrick’s software can ensure workers are watching the briefings until the end, and the data can be used to provide reports for audits, documentation, and other purposes.
A CPA firm documenting continuing education credits
A certified public accounting firm uses Vbrick’s analytics for documentation and proof related to accreditation. They want to be sure each person is watching their training videos and that employees are fulfilling their continuing professional education (CPE) credits.
The firm’s live events feature polls and Vbrick’s analytics can show who answered which question and when, ensuring that users are present and paying attention. To make sure people are who they say they are, the company also uses advanced video analytics software to see what device and browser the person used, and other identifying information. This is useful for auditing and security purposes.