 | Disable Server button. Click to enable or disable streaming on the DME and terminate all connections. The “Server is Running” message will be replaced with “Server is Idle.” |
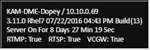 | Displays DME information specifics: ●DME name ●IP address ●DME software code revision currently installed ●Aggregate up time since the last server reset ●RTMP / RTSP / VCGW stream capability status. Color will change depending upon status. If the VCGW is not enabled, this will display red. |
 | Server status. The “Server is Running” message will change to “Server is Idle” if the Disable Server button is toggled. The field’s background color will change indicating its health status. The server status (Normal, Warning, and Alert) is tied to Content Disk, CPU, Throughput and Memory status – any elevation of these statuses will be reflected in this status. (Note: Disk usage is not currently shown, but the status thresholds are Normal (0%-75%), Warning (76%-85%), and Alert (> 85% OR less than 32GB free). |
 | This area displays the number of streams going through your Multiprotocol server, your stream capacity, and associated CPU usage. This covers your RTMP, RTMFP, HLS, and HDS streams. |
 | This area displays the number of streams going through your RTP server, your stream capacity, and associated CPU usage. |
 | Snapshot of the memory use in your system. Memory is measured as your physical plus swap. The field’s background color will change indicating its health status. The available statuses are: Normal (0%-50% memory usage), Warning (51%-85%), and Alert (> 85%). As a snapshot, this is a transient measure that may self-correct. |
 | Snapshot of the aggregated CPU use. The background color will change depending upon status. The field’s background color will change indicating its health status. The available statuses are: Normal (0%-70% CPU usage), Warning (71%-80%), and Alert (> 80%). As a snapshot, this is a transient measure that may self-correct. |
 | Snapshot of current throughput. The field’s background color will change indicating its health status. The available statuses are: Normal (0%-60% throughput usage), Warning (61%-90%), and Alert (> 90%). As a snapshot, this is a transient measure that may self-correct. |
 | Countdown until the Status Bar values are refreshed automatically by the DME. Refresh link to refresh them manually. If the Status Bar does not automatically refresh, you may also refresh the whole page using your browser refresh. |
Status to denote if the DME is linked to Rev and if the Rev interface is running. |